维州行人事故:热点与道路条件分析Victorian Pedestrian Crashes: Hotspots and Road Conditions
事故集中在哪里?这些地方的事故,在天气、路况等条件上与全州有什么不同?Where do crashes concentrate, and how do their recorded conditions differ from Victoria overall?
- 项目背景:课程作业要求为澳洲维州交通部门做决策看板,判断应优先在哪些区域改善行人安全。
- 工作内容:整合 4 张官方表、1.7 万起事故;圈选区域可按天气、光线、路况与全州对比事故占比,注明事故多可能只因人多。
- 项目结果:看板显示 65 岁以上行人占事故 20.4%,却占死亡事故 41.8%;作业 84.3/100(班均 70.0),获最高档 H1。
- Coursework: a decision dashboard for Transport Victoria on where to improve pedestrian safety first.
- Joined 4 official tables (17,510 pedestrian crashes) into a map filterable by year, time of day and age; select any area to compare its share of crashes under weather, light and road conditions with the whole state; the page notes that more crashes may just mean more people.
- Scored 84.3/100, an H1 (top band; class mean 70.0). The dashboard shows people 65+ are 20.4% of crashes but 41.8% of fatal ones.
- 数据Data
- 维州交通规划部 4 张官方表(2012–2025 年的事故,CC BY 4.0);墨尔本市行人流量4 official tables from Victoria's Department of Transport and Planning (crashes 2012–2025, CC BY 4.0); City of Melbourne footfall
- 视图Views
- 热点、事故点、人流三种地图Three maps: hotspots, crashes, footfall
- 筛选Filters
- 年份、严重程度、时段、行人年龄Year, severity, time of day, pedestrian age
- 作业要求The brief
- 为明确的决策者设计:帮维州交通部门调查行人事故并采取行动Design for a named decision-maker: help Transport Victoria investigate pedestrian crashes and act on them
打开浏览器就能用的网页版A web version that runs in the browser
另做了一个网页版,用的是同一份公开数据:17,510 起行人事故和 84 个行人流量传感器。热点、事故点、人流三种地图和筛选都在。I also built a web version on the same public data: 17,510 pedestrian crashes and 84 footfall sensors, with the hotspot, crash and footfall maps and the filters.
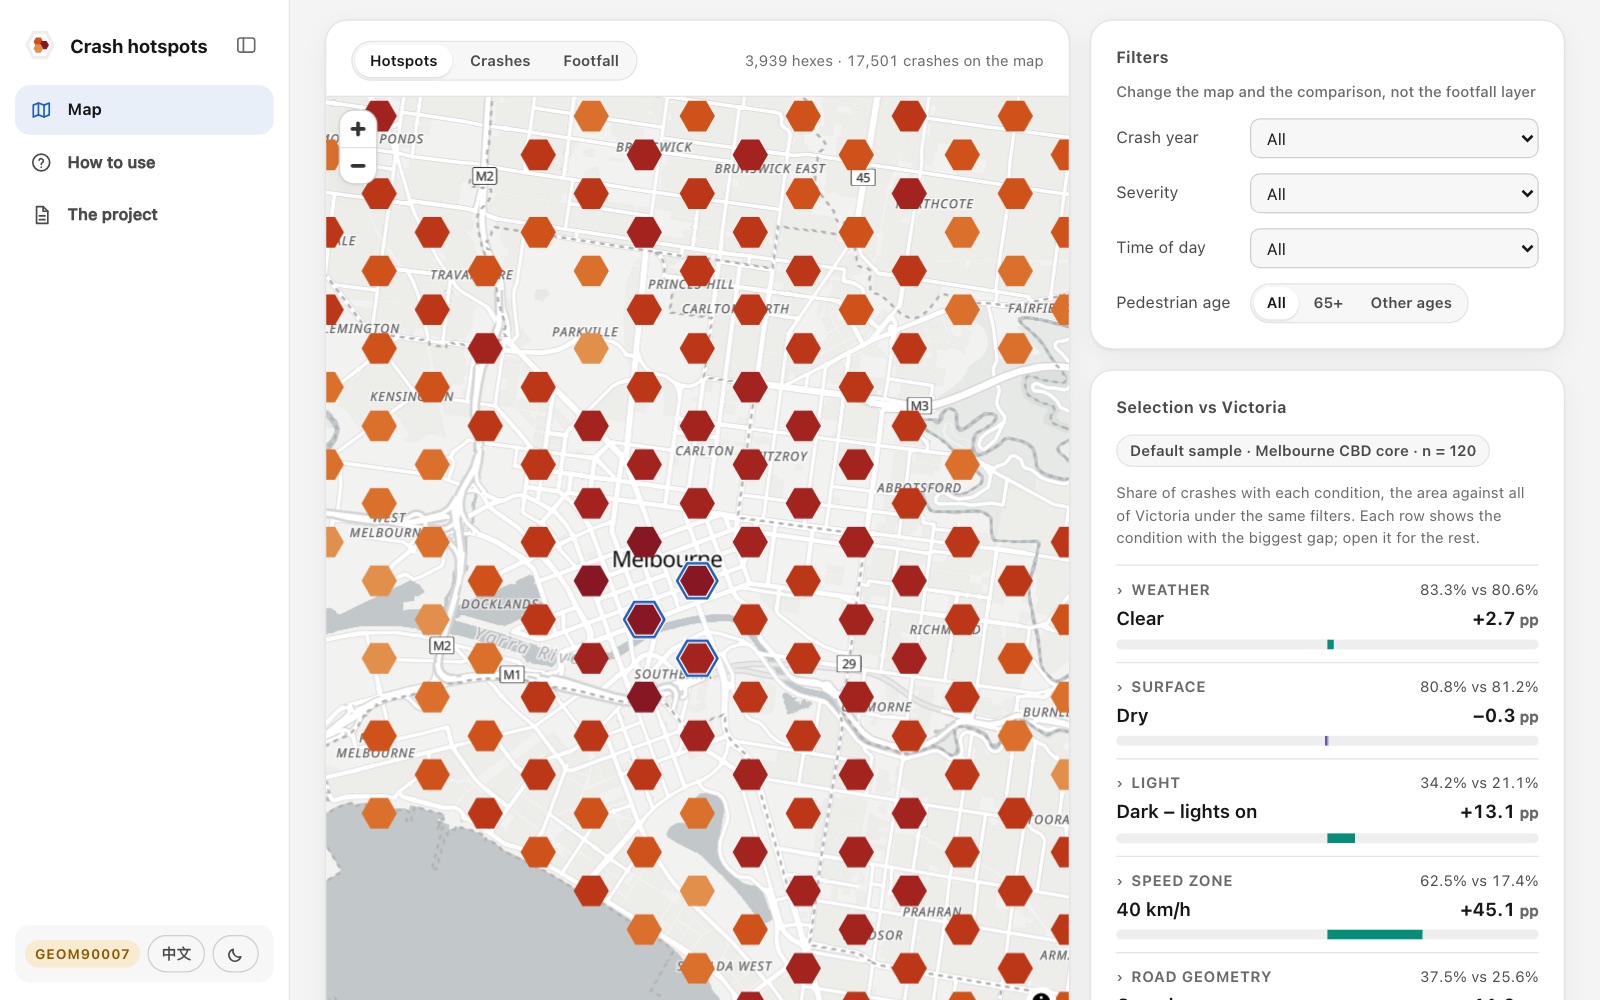
提交版的六种画面Six views of the submitted version
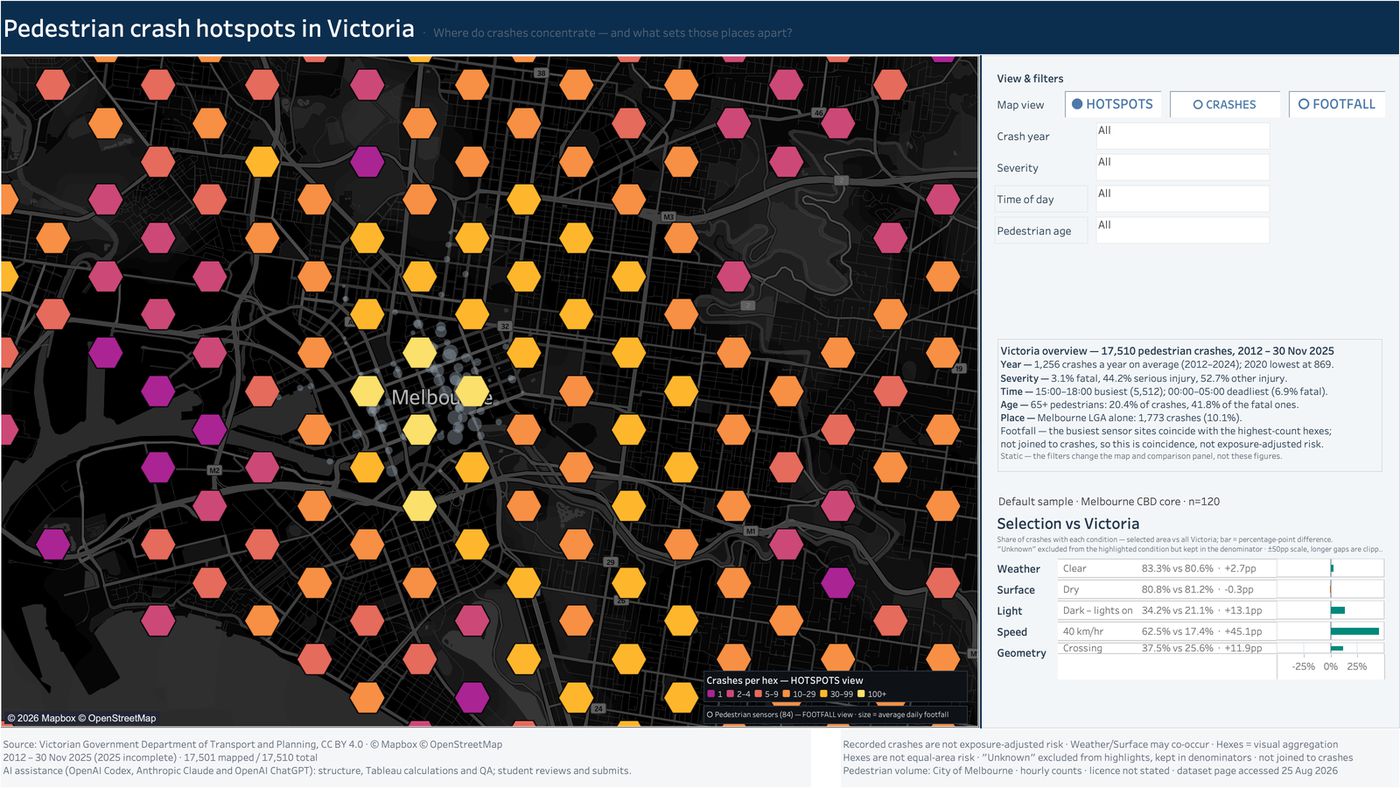
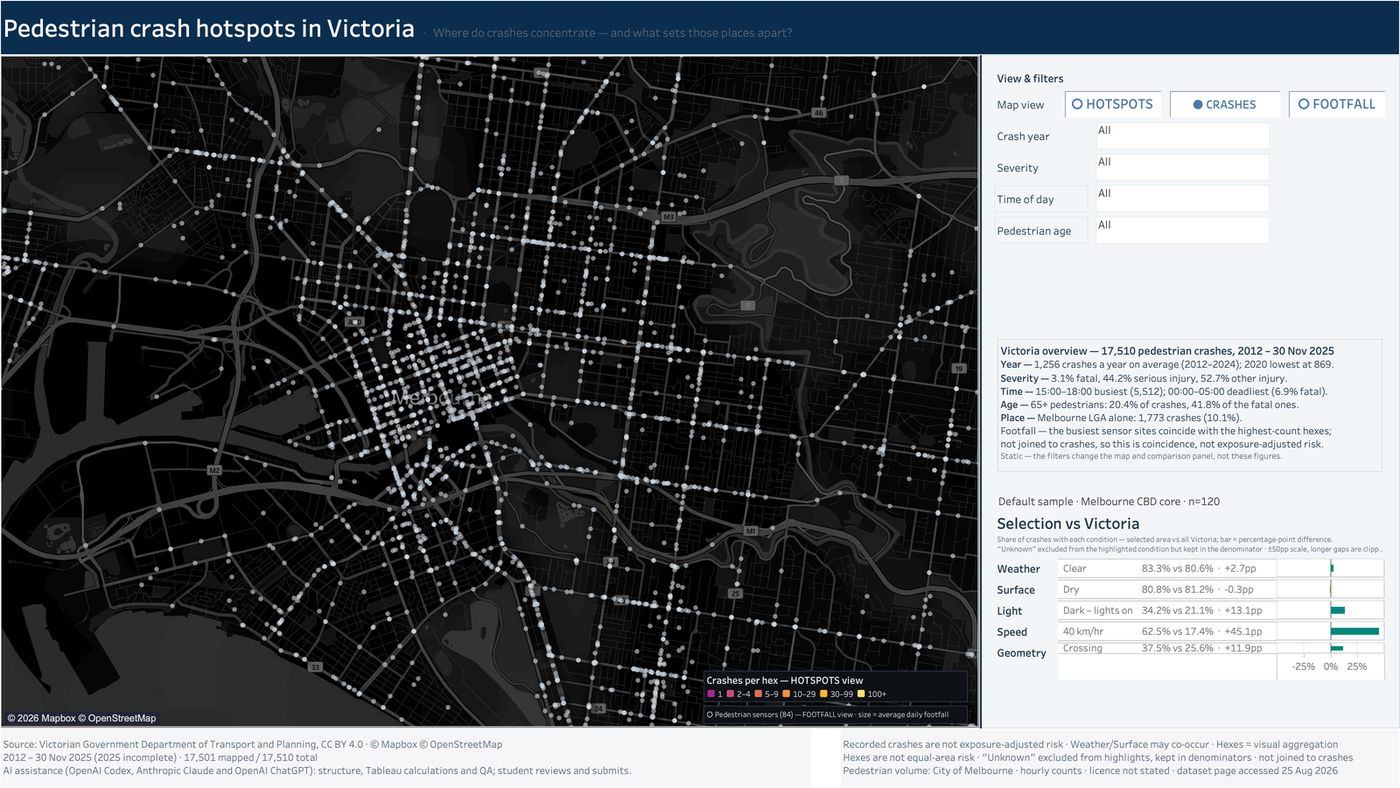
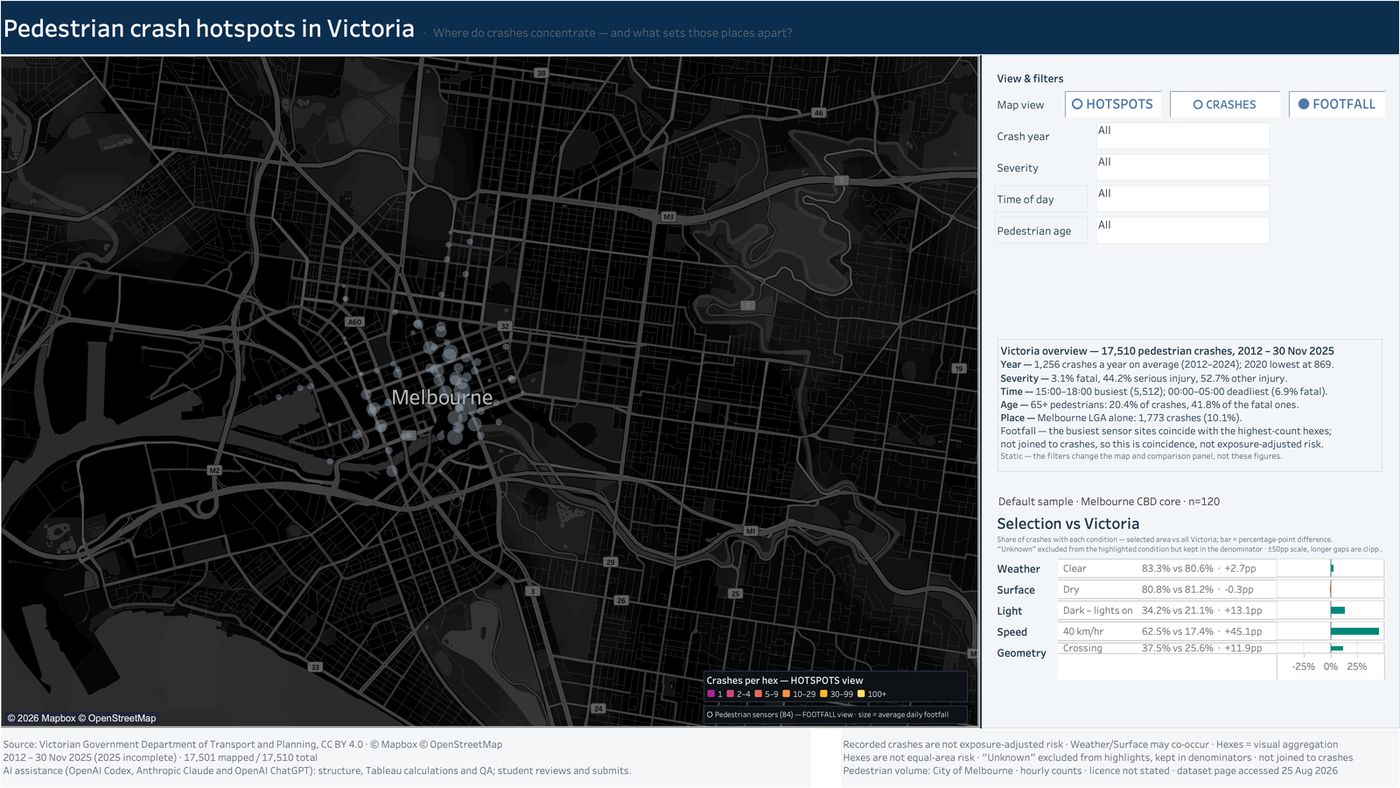
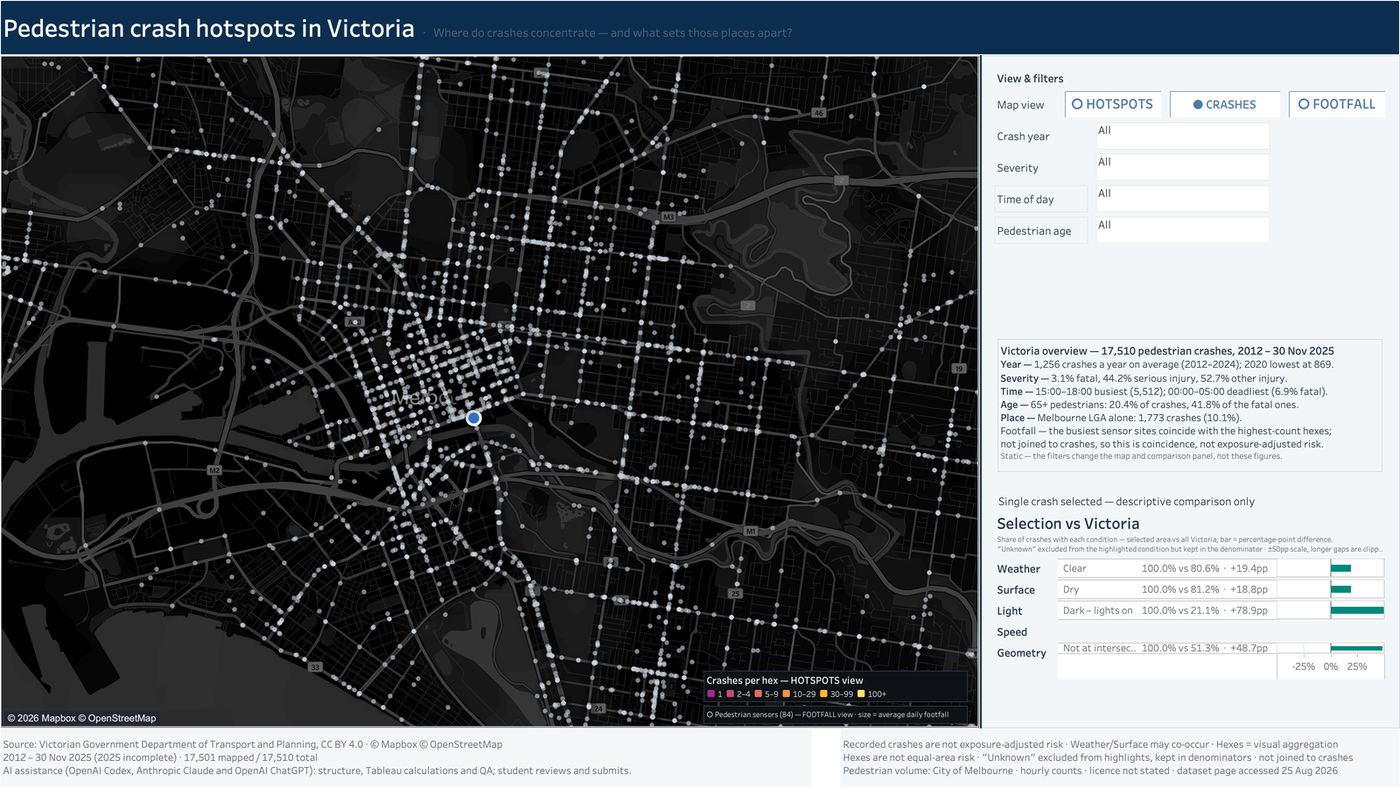
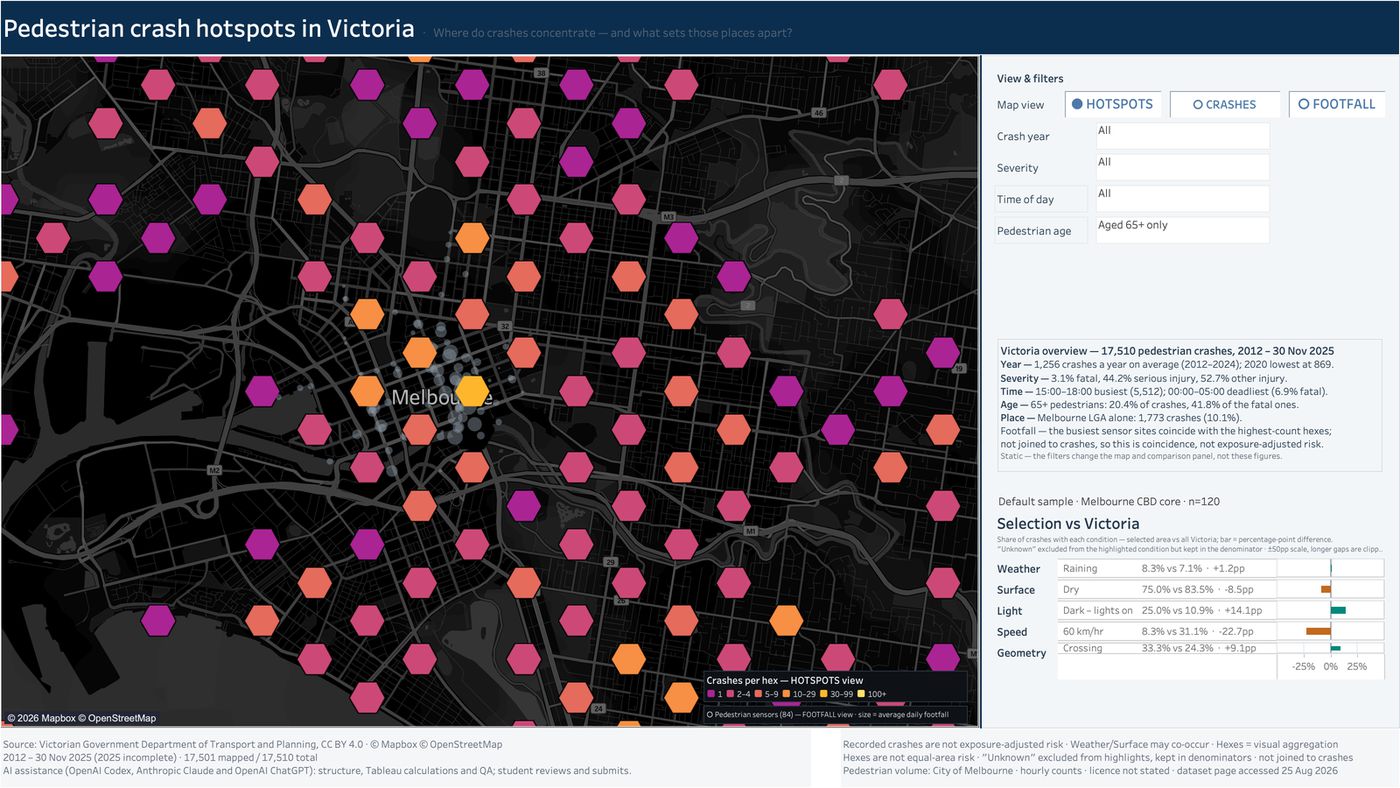
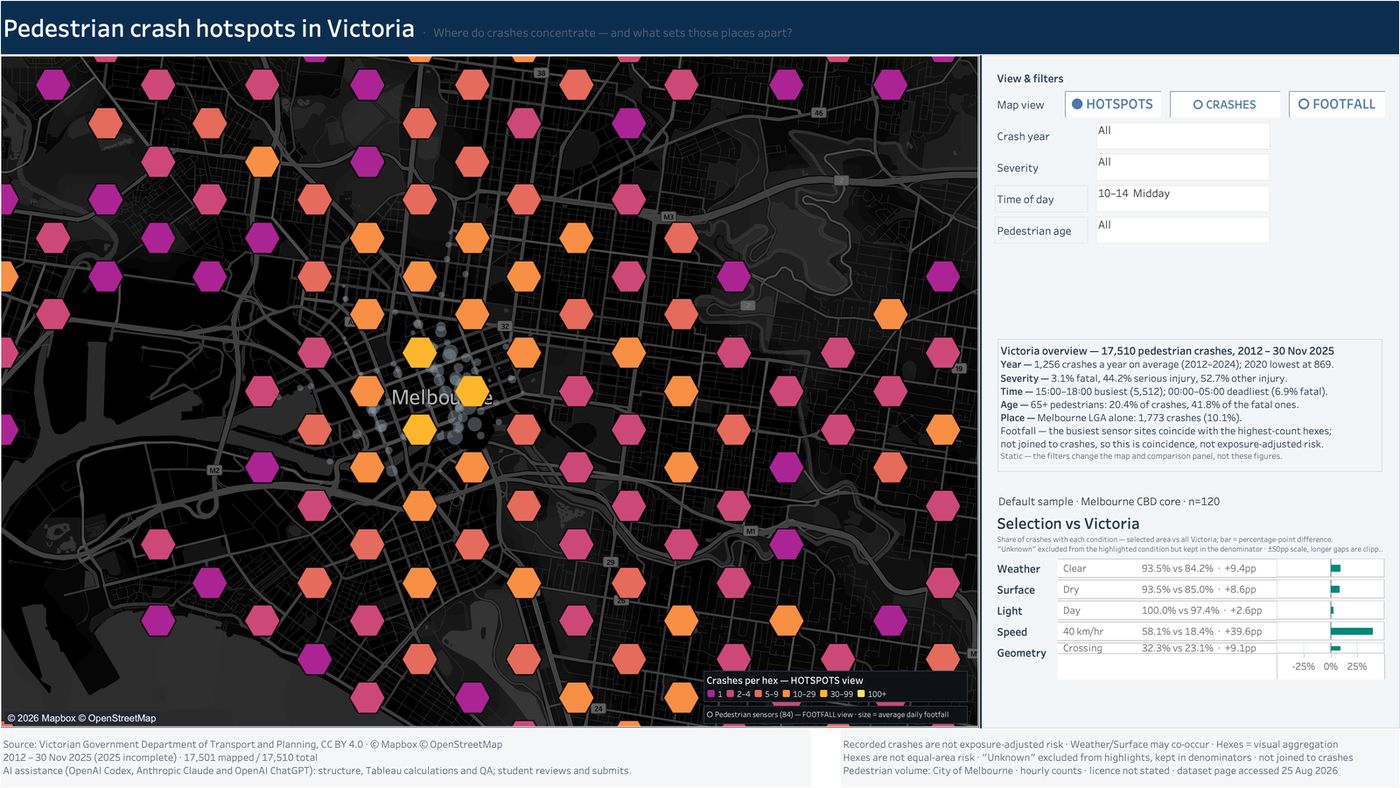
看板是 Tableau 文件,这里放提交版(v36)的六种画面,交作业前逐一检查过。点图看大图。The dashboard is a Tableau workbook, so these are the six states of the submitted version (v36) that were checked one by one before submission. Click to enlarge.
我做的三个取舍Three trade-offs I made
从区域差异中找调查线索Find leads in local differences
圈选事故集中区域,在同样筛选条件下,与全州比较天气、路面、光线、限速和道路形态下的事故占比。用百分点差呈现当地的突出特征,帮助确定值得进一步调查的道路情境。Select a crash cluster and compare its shares under weather, surface, lighting, speed-limit and road-geometry conditions with Victoria under the same filters. Percentage-point gaps highlight local patterns worth investigating.
把局限写在图上Put the limits on the dashboard
条件占比的差异提供调查线索,不能据此认定某个条件导致事故。事故数也不等于按出行量调整后的风险;人流传感器只作背景,没有与事故记录关联。Differences in recorded conditions provide leads, without establishing that a condition caused crashes. Counts are not exposure-adjusted risk; footfall sensors provide context and are not joined to crash records.
一个看板,三种视图One dashboard, three ways to look
热点看哪里多,事故点看具体哪一起,人流看哪里人多;三种视图共用同一组筛选。Hotspots show where crashes cluster, crash dots show individual cases, footfall shows where people are; all three share one set of filters.
H1(最高档),84.3/100,班均 70.0(291 人)84.3/100, an H1 (top band); class mean 70.0
老师评语的开头:“outstanding technical and conceptual work”。The marker's feedback opens with “outstanding technical and conceptual work”.